☰
🔍
☰
🔍
 ☰
🔍
☰
🔍
23 November 2015
Posted by, Jamal Eason, Product Manager, Android
One the most requested features we receive is to make app builds and deployment faster in Android Studio. Today at the Android Developer Summit, we’re announcing a preview of Android Studio 2.0 featuring Instant Run that will dramatically improve your development workflow. With Android Studio 2.0, we are also including a preview of a new GPU Profiler.
All these updates are available now in the canary release channel, so we can get your feedback. Since this initial release is a preview, you may want to download and run an additional copy of Android Studio in parallel with your current version.
Android Studio’s instant run feature allows you to to quickly see your changes running on your device or emulator.
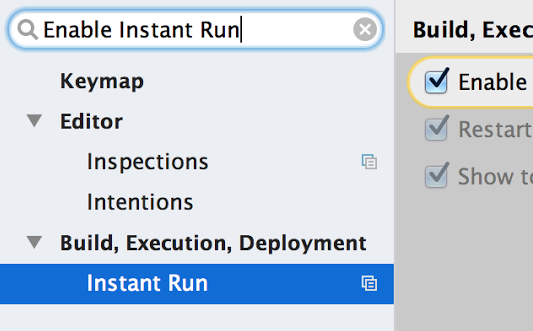
Getting started is easy. If you create a new project with Android Studio 2.0 then your projects are already setup. If you have a pre-existing app open Settings/Preferences, the go to Build, Execution, Deployment → Instant Run. Click on Enable Instant Run... This will ensure you have the correct gradle plugin for your project to work with Instant Run.

Select Run as normal and Android Studio will perform normal compilation, packaging and install steps and run your app on your device or emulator. After you make edits to your source code or resources, pressing Run again will deploy your changes directly into the running app.

For a more detailed guide setup and try Instant Run, click here.
Profiling your OpenGL ES Android code is now even easier with the GPU Profiler in Android Studio. The tool is in early preview, but is very powerful and not only shows details about the GL State and Commands, you can record entire sessions and walk through the GL Framebuffer and Textures as your app is running OpenGL ES Code.

To get started, first download the GPU Debugging Tools package from the Android Studio SDK Manager. Click here for more details about the GPU Profiler tool and how to set up your Android app project for profiling.
This is just a taste of some of the bigger updates in this latest release of Android Studio. We'll be going through the full release in more detail at the Android Developer Summit (livestreamed on Monday and Tuesday). Over the next few weeks, we'll be showing how to take advantage of even more features in Android Studio 2.0, so be sure to check back in.
If you're interested in more Android deep technical content, we will be streaming over 16 hours of content from the inaugural Android Developer Summit over the next two days, and together with Codelabs, all of this content will be available online after the Summit concludes.
Android Studio 2.0 is available today on the Android Studio canary channel. Let us know what you think of these new features by connecting with the Android Studio development team on Google+.
Android Developers


 Google Play